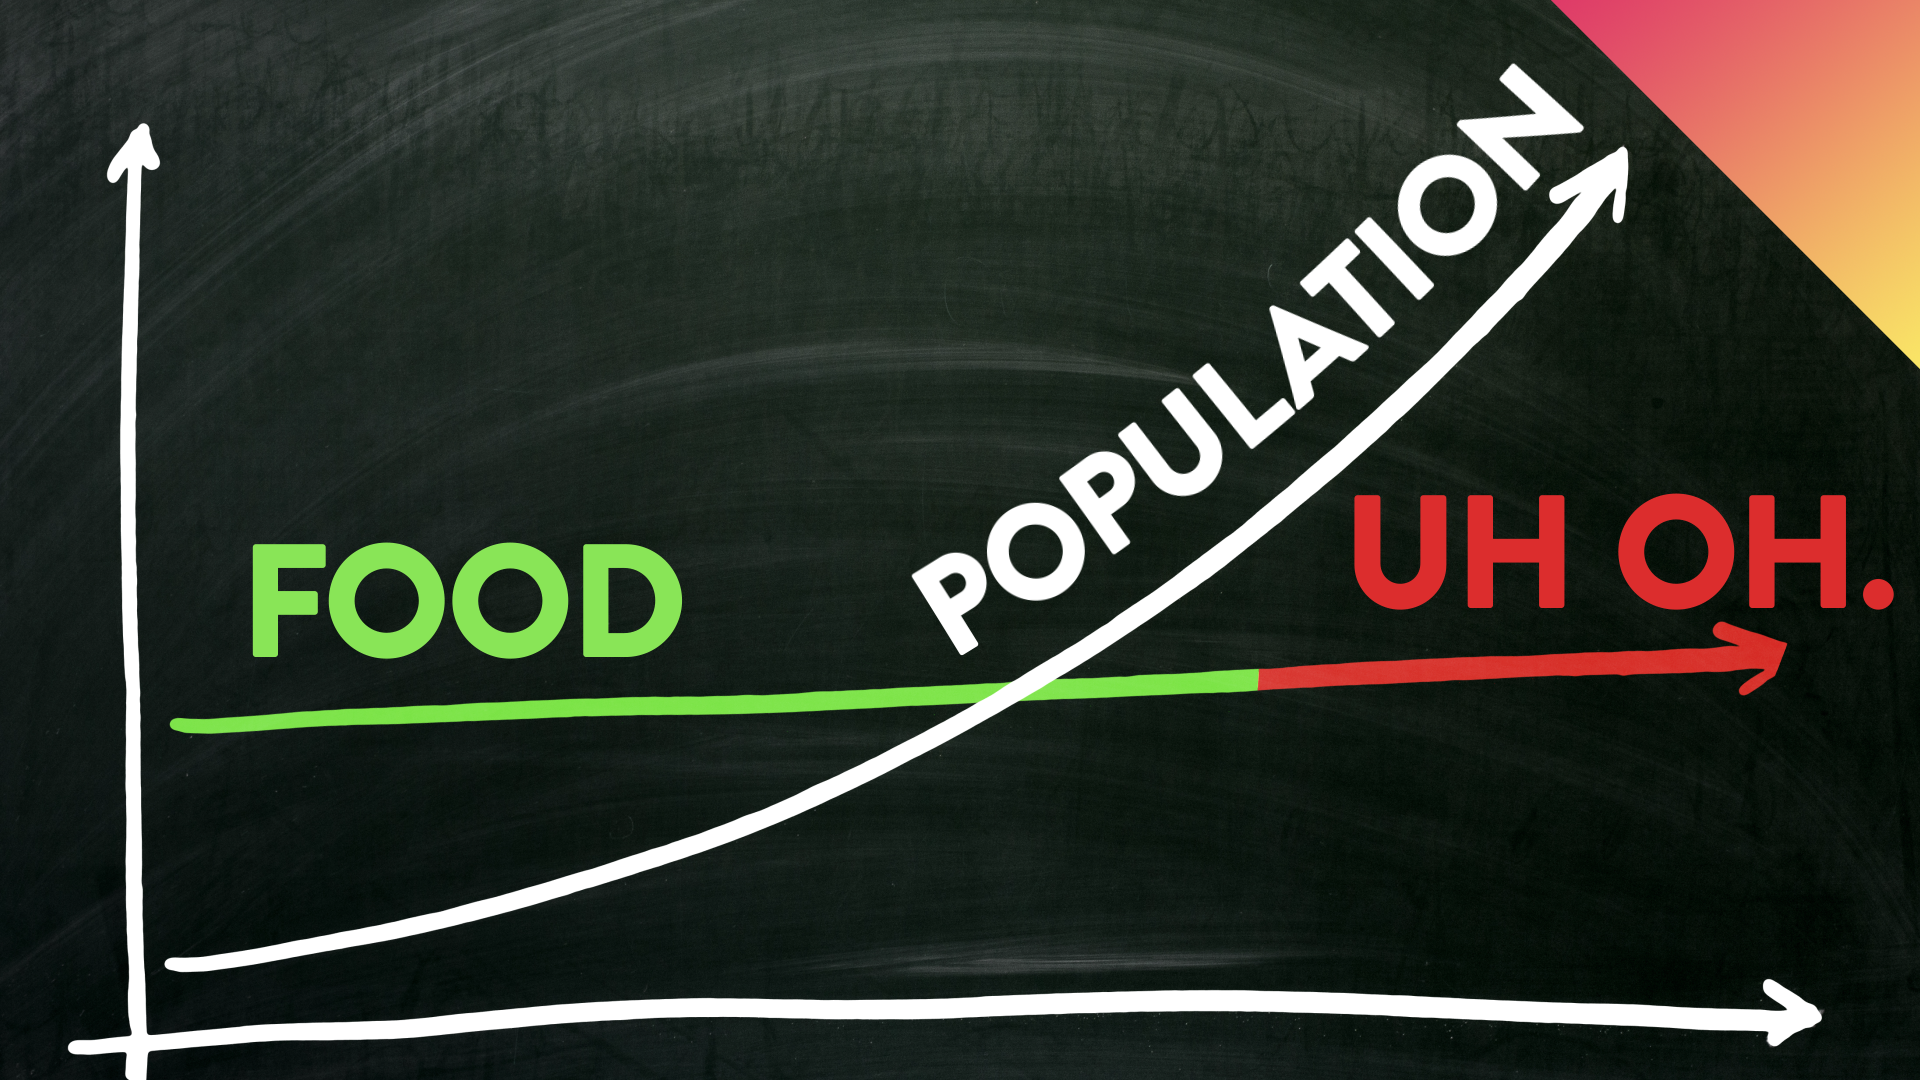
If you tried to sum up the last 150 years or so in one image, a chart of exponential growth would be a good place to start. You could apply it to life expectancy. Or compound interest. Or any number of things. But especially population growth. As we face a future population of 10 billion and a world impacted by climate change, how will we do a Green Revolution 2.0?
Paste this code where you want the video to appear.
TV Schedule Filters
Location Help
KET provides PBS national programming for all viewers in our broadcast areas. We use your web browser to confirm your location.
If you're a KET donor, you may watch this content from anywhere in the United States.
We provide online video of PBS national programming for KET viewers. Please allow KET to access your web browser's location to watch this video.
Explore KET
Ad Blocker Detected
It appears your browser is using an ad blocker. In addition to blocking ads, this software affects our ability to properly detect your location, which we must do before allowing access to video content. Please add KET.org to your safe list or disable your ad blocker for the best experience.